Contents
This section of the interface serves to initialize a protein, its chemical shifts, and the internuclear correlations of interest that define a spectrum. Once the required input parameters and data are specified, click on "Create spectrum" to initialize the spectrum. Simulated spectra will appear in the Added Spectra subsection.
Protein
Define your protein in this section.
You can define a name for your protein in the Protein Name field. This name will be used for the names of all spectra generated for this protein (see the Added Spectra section).
The protein sequence can be pasted in plain one-letter code or FASTA format into the Protein Sequence field. Alternatively, it will be extracted from a PDB file uploaded via the PDB File upload dialog. If both a sequence and a PDB file are given, Peakr will attempt to map the sequence in the PDB file onto the sequence pasted in the Protein Sequence box. If there are mismatches between the PDB file and the pasted sequence, an error message will be given. Otherwise, the longer of the two sequences will be used. Note that in this case the amino acid numbering might not be identical. For example, if the pasted sequence contains additional residues within a structural element of the PDB file, the numbering of the sequence used for the simulated spectra does not necessarily correspond to the numbering in the PDB file anymore.
If the PDB file contains several chains or models, it can be selected which one should be used for spectrum calculation after initializing the spectrum by clicking "Create Spectrum". Then, chain and model selection is possible in the "Added Spectra" section of the interface (see below). By default, the first chain or model in the PDB file is used.
A PDB file uploaded in the Protein section will also be used for prediction of chemical shifts using the interfaced software tools (see section Chemical Shifts) and for simulation of through-space correlations (see Correlations section).
Chemical shifts
Add chemical shift data to your protein.
Chemical shifts can be added from user-provided lists, by PDB-based predictions, or by using database values. Also, combinations of these options are possible.
-
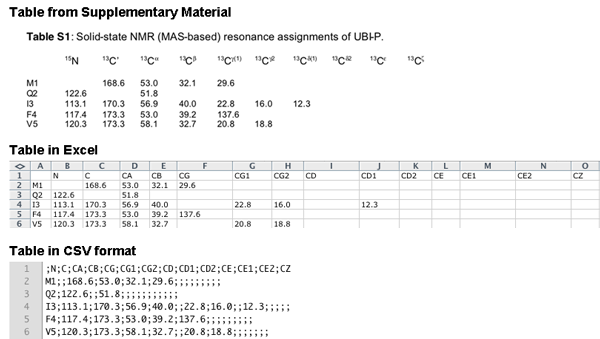
Shift list: Upload a file in the format of a Sparky (http://www.cgl.ucsf.edu/home/sparky) resonance list, in the format of a ShiftX (http://shiftx.wishartlab.com) output file, or as semicolon delimited file (CSV). CCPN provides a service of format conversion, CCPN NMR format converter (e-NMR web portal), which can be used to convert shift lists from other formats into Sparky or ShiftX formats. CSV files can be generated from e.g. Excel or the Supplementary Materials of publications. The CSV file should contain the nuclei in BMRB nomenclature in the first line and the values for each residue in the following lines. An example is shown below for converting data from the supplementary material of Seidel,K. et al. 2005 High-Resolution Solid-State NMR Studies on Uniformly [13C,15N]-Labeled Ubiquitin. ChemBioChem, 6, 1638–1647.

- Prediction: Predict chemical shifts based on the PDB file uploaded in the Protein section. Currently, chemical shifts can be predicted using:
- ShiftX (http://shiftx.wishartlab.com)
- ShiftX2 (http://www.shiftx2.ca/)
- SHIFTS (http://casegroup.rutgers.edu/qshifts/about.htm)
- SPARTA (http://spin.niddk.nih.gov/bax/software/SPARTA/index.html#how_to_use)
- SPARTA+ (http://spin.niddk.nih.gov/bax/software/SPARTA+/)
- shAIC (http://www.bionmr.chem.au.dk/bionmr/software/shaic.php)
- CamShift (http://www-vendruscolo.ch.cam.ac.uk/camshift/camshift.php)
- Database: Use (average) database values for the chemical shifts of the protein. Currently, Peakr offers using average values from the restricted set of protein chemical shifts of the Biological Magnetic Resonance Data Bank (http://www.bmrb.wisc.edu/ref_info/statsel.htm). These are queried directly upon request, so are always up-to-date.
If a combination of these methods is selected (e.g. Shift list + Simulation), the order of preference for the use of chemical shifts is as follows: 1. Shift list; 2. Prediction; 3. Database. This means that all nuclei for which shift values can be found in a shift list uploaded by the user will be assigned these shift values. Other nuclei will be assigned shift values from chemical shift prediction if available, and database values otherwise. The option "Prediction - Shift list" (i.e. prediction minus shift list) allows to select only those values of a chemical shift prediction for which no values are contained in a user-specified shift list, in order to generate spectra that illustrate which peaks of a spectrum generated using the option "Shift list + Prediction" originate from predictions.
Correlations
Define the desired correlation for the simulation of the spectrum.
The name defined for a correlation in the Correlation Name field will appear in the name of the spectra generated using this correlation (see the Added Spectra section).
Available correlations:
- C-C intraresidue: (13C,13C) correlations within individual residues. Define the desired sidechain depth to be considered for simulation in the Depth field. Number of Bonds: specify 1 for one-bond correlations, 2 for one- and two-bond correlations, etc.. Click Single Bond Distance if only correlations with the specified number of bonds between nuclei should be simulated (i.e., for number of bonds equal to 3, do not predict 1- and 2-bond correlations).
- C-C interresidue: (13C,13C) correlations between residues. Depth defines how many sidechain nuclei will be taken into account for the simulation. Residue Range specifies the inter-residue distance to be considered for simulation (1: directly neighboring residues only, 2: up to 2 residues, etc). If Single Residue Range is checked, correlations will be calculated only for residues spaced apart in the sequence by the value specified in Residue Range, and not for residues closer to each other.
- C-C double quantum: Intraresidue (13C,13C) correlations as in an INADEQUATE-type double quantum - single quantum correlation experiment. In the indirect spectral dimension, the shift of a cross-peak generated using this correlation will correspond to the sum of the chemical shifts of the nuclei involved in the correlation. Depth is defined as in C-C intraresidue correlations. Only one-bond correlations are considered.
- N-C intraresidue: N(i)-C(i) (NCACX) correlations. Depth refers to the number of bonds between the backbone 15N nucleus and the desired carbon nuclei (CA for N-CA correlations, CB for N-CA, N-CO and N-CB correlations, etc).
- N(i)-C(i-1) interresidue: N(i)-C(i-1) (NCOCX) correlations. Depth refers to the number of bonds between the backbone 15N nucleus and the desired carbon nuclei in the previous residue (1 for N(i)-CO(i-1) correlations, 2 for N(i)-CO(i-1) and N(i)-CA(i-1) correlations, etc).
- Through-space: Simulate through-space correlations based on the PDB file uploaded in the Protein section. Correlations will be simulated for all pairs of (15N,13C) or (13C,13C) nuclei with an internuclear distance smaller than the value given in the Distance Cutoff field and larger than the value provided as Distance Threshold. Depending on the choice of Atom Mode, either the distance between these heteronuclei themselves will be taken into account, or the smallest distance between any two protons directly attached to them (if the NHHC or CHHC atom mode is selected). The Mode field allows to choose between intra- or intermolecular correlations. If Mode is set to intermolecular, it can be chosen whether correlations should be calculated between all available chains ("All chains"), between one specific chain and all others ("One chain with all others"), or only between two specified chains ("One chain with another") in the PDB file. The Minimum Residue Distance field allows to specify (in residue number difference) how far apart in the protein sequence two residues should be to be considered in the simulation. This way, e.g. intraresidue and short-range correlations can be excluded.
Added spectra
Here, all available spectra are listed. The functions of the buttons and fields available for each spectrum are explained below.

- Checkbox to select spectrum for display in the 'Resultant spectra' section. After selecting the desired spectra here, click 'Display selected spectra' below the 'Resultant spectra' heading.
- Open a separate window and display the list of peaks in the spectrum in the format of a Sparky peak list. This list can also directly be downloaded.
- Show the settings used to generate the spectrum.
- Clone the spectrum. A second spectrum will be generated based on the same settings and data as the current one. Clones can be used, e.g., to visualize the same spectrum using different parts of the protein sequence or a subset of its residue types, using the selection tools explained further below.
- Download the spectrum (settings and peaks) as text file.
- Delete the spectrum.
- Displays the spectrum name. It is composed of the names of the protein and of the correlation used to generate the spectrum, separated by an underscore. If the spectrum was cloned, the spectrum name contains e.g. a '_1', '_2' after the original name.
- Allows to select a specific carbon labelling scheme.
- Allows for selection of one of the chains in the uploaded PDB file, if present. If no PDB file is in use, or no chains are defined, 'n/a' is displayed.
- Allows for selection of one of the models in the uploaded PDB file, if present. If no PDB file is in use, or no models are defined, 'n/a' is displayed.
- Select first and last residue of a region of interest. Default values are the first and last residue of the entire protein sequence provided. Only cross-peaks from the part of the sequence defined here will be shown in the spectrum display.
- Lists all amino acid types present in the protein sequence. By default, all of them are used for spectrum simulation. If one or more amino acid types are selected here, the spectrum will only display cross-peaks involving these amino acid types.
- Allows to select residues based on secondary structure assignment. If not provided in the PDB file, the secondary structure is predicted using Psipred.
13C labelling schemes
Select the desired 13C labelling scheme for spectrum simulation. These labelling schemes are obtained by expressing a protein using the respective chemical as sole carbon source.
The option "Graded opacity" displays simulated peaks with varying levels of opacity (i.e., color intensity) according to the probability that both contributing nuclei are 13C carbons in the selected labelling scheme.
Available labelling schemes:
-
1,3-13C-glycerol:
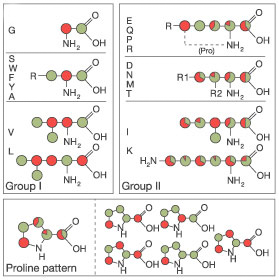
This precursor leads to site-specific labelling as outlined in Figure 1 below and described in reference [1].
Amino acids synthesized via the glycolysis pathway (group I) exhibit labelling patterns of ~100 % (green) and ~0% (red) 13C enriched sites.
More complex patterns are found for amino acids synthesized via the citric acid cycle (group II).
Many isotopomers with different labelling patterns are obtained (see the lower part of Figure 1 for a detailed list of proline isotopomers).
A complete list of isotopomers for all amino acids can be found here:
Protein NMR - A Practical Guide - Isotopic Labelling).
For simulating intraresidue (13C,13C) cross-peaks with this labelling pattern, Peakr makes use of the isotopomer schemes to calculate the probability that a cross-peak is observed. That is, even though, for example, any carbon atom of aspartic acid may be isotope-labelled when using 1,3-13C-glycerol as carbon source, CO and CG nuclei are never observed to be isotope-labelled within the same aspartic acid residue. Therefore, Peakr will not simulate CO-CG cross-peaks for aspartic acid in this case. For interresidue correlations, the overall probabilities of individual nuclei to be 13C-labelled (averaged over isotopomers) are used and multiplied with each other to give the probability of occurrence of a cross-peak. By default, these probabilities are reflected in the spectrum display as opacities of the points corresponding to the simulated cross-peaks. If the checkbox "Graded opacity" is deselected, all cross-peaks for which both contributing nuclei have non-zero labelling probability are displayed with 100% opacity.

Figure 1: Diagram, adopted from [1], showing the labelling pattern obtained by growth on 1,3-13C-glycerol. Labelled atoms are marked in green, unlabelled atoms in red. By growth on 2-13C-glycerol the inverse scheme is obtained (i.e., labelled atoms in red, unlabelled atom in green).
[1] F. Castellani, B. van Rossum, A. Diehl, M. Schubert, K. Rehbein & Oschkinat H. (2002) Structure of a protein determined by solid-state magic-angle-spinning NMR spectroscopy. Nature 420:98-102.
-
2-13C-glycerol:
This precursor leads to the inverse labelling pattern of that obtained with 1,3-13C-glycerol (see comments there and Figure 1).
-
1-13C-glucose:
This precursor results in a labelling pattern very similar to that obtained from 1,3-13C-glycerol, but with reduced overall 13C content. Based on
amino acid synthesis pathways, the same isotopomer schemes as for 1,3-13C-glycerol are expected. However, isotopomers were not treated separately in the
literature. For simulating spectra of proteins expressed using 1-13C-glucose, Peakr thus uses the simplified scheme shown in ref. [2] which is expected if
amino acid precursors pass 3 times through the citric acid cycle.
[2] P. Lundström, K. Teilum, T. Carstensen, I. Bezsonova, S. Wiesner, D.F. Hansen, T.L. Religa, M. Akke & L.E. Kay (2007) Fractional 13C enrichment of isolated carbons using [1-13C]- or [2- 13C]-glucose facilitates the accurate measurement of dynamics at backbone Calpha and side-chain methyl positions in proteins. J Biomol NMR 38:199-212.
- 2-13C-glucose: This precursor leads to an almost inverse labelling scheme as compared to 1-13C-glucose. The scheme used in Peakr is adopted from [2] and based on the assumption that precursors for oxaloacetate-based residues pass at least 1 times through the citric acid cycle and precursors for α-ketoglutarate-based amino acids pass the cycle at least 2 times, using a 13C enriched molecule of acetyl-S-CoA in each round.
Upload experimental spectra for comparison with simulations.
Data for experiments
Upload processed 2D spectra in the formats of Bruker XWinNMR/Topspin, Varian/Agilent VNMR/VnmrJ, or NMRPipe. For Bruker format, the '2rr', 'procs', and 'proc2s' files of the processed spectrum directory are required. For Varian/Agilent, the 'phasefile' file (typically found in the 'datdir' subdirectory of the experiment's directory in the 'vnmrsys' folder) and the 'procpar' file are needed. Before saving the 'phasefile' in VNMR/VnmrJ (by the 'flush' command or by navigating to another experiment), the entire spectrum must be displayed in VNMR/VnmrJ. For NMRPipe-format spectra, only the .ft2 processed spectrum file is required. Click 'Add experiment' to upload the data.
Added experiments
This section lists available uploaded experimental spectra. To display an experimental spectrum in the 'Resultant spectra' window, select it by clicking its checkbox. Then, click 'Display selected spectra' below the 'Resultant spectra' heading.
Resultant spectra
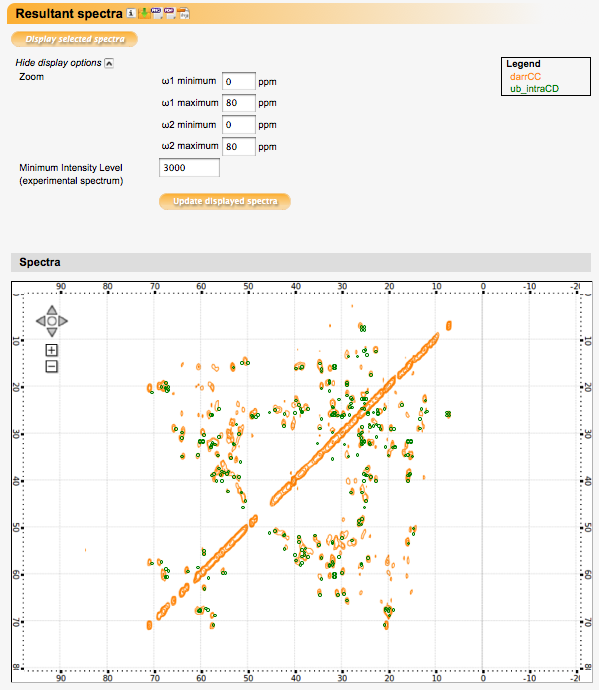
Displays selected simulated and experimental spectra.
Buttons next to the 'Resultant Spectra' section heading allow for downloading a session file containing all data and settings, or the spectra displayed in the spectrum display window in various formats (PNG, PDF, or SVG).
Display options:
Zoom: Select a region of the spectrum (in ppm) to display.
Minimum intensity level (experimental spectrum): Select the lowest intensity level for which contours should be drawn in the experimental spectrum (if one is selected).
Click 'Update displayed spectra' for changes in this section to take effect.

Comparison
Numerical comparison of selected simulated and experimental spectra.
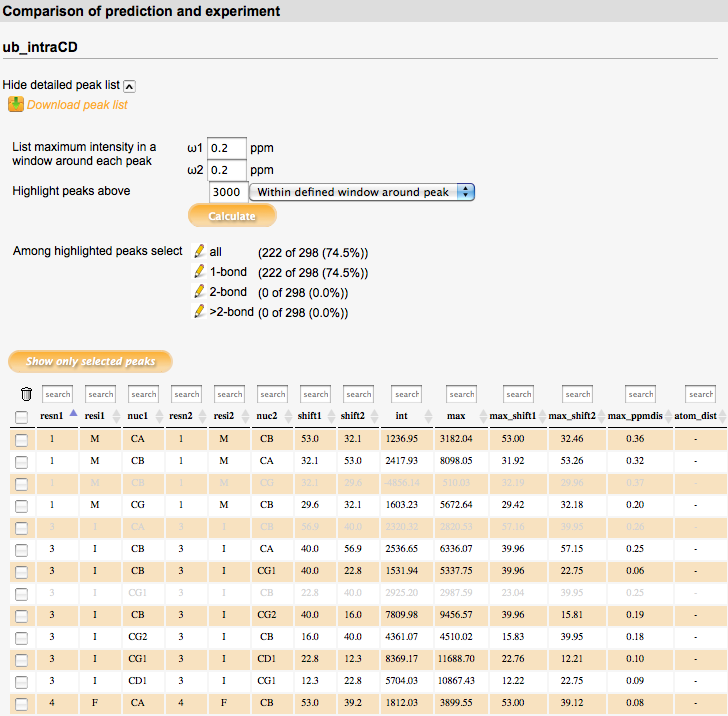
For each selected simulated spectrum, a detailed peak list can be displayed which shows the spectral intensity in the selected experimental spectrum at the position of each simulated peak. For each simulated peak, the experimental spectrum intensity at its exact position (column 'int') as well as the maximum intensity in a defined window around the peak (specified in ppm units under 'List maximum intensity in a window around each peak'; column 'max') is listed. The exact position of the maximum intensity found in the defined window as well as its distance from the simulated peak (in ppm) is also listed (columns 'max_shift1/2', 'max_ppmdist'). For through-space correlation spectra, the distance between the two atoms of the peak (or between their bound protons in the case of NHHC/CHHC correlations) in the PDB file is listed in the 'atom_dist' column.
The intensity value specified in the 'Highlight peaks above' field defines a threshold value. Simulated peaks with corresponding intensity in the experimental spectrum above this threshold (at the exact peak position or in the defined region around each peak, as selected) are highlighted in the peaklist after clicking the 'Calculate' button below the input field. Further selections can be made among the highlighted peaks in the 'Among highlighted peaks select' section. In this section, also the number and percentage of currently highlighted peaks (i.e. peaks above the intensity threshold) are displayed. Predefined selections depend on spectrum type; e.g., in intraresidue correlation spectra, correlations with different numbers of bonds can be selected, or in through-space correlation spectra, correlations within different distance ranges. Number and percentage of peaks in these subclasses are also shown. In addition, individual peaks in the peaklist can be selected using the checkboxes in the leftmost column. Each column in the peaklist can be searched for specified values using the input field at the top of the column.
By clicking the 'Show only selected peaks' button, only the peaks selected in the peaklist will be displayed in the spectrum display window. 'Show all peaks' reverts to displaying all peaks of the spectrum.


